
Improving LCP Step by Step: The Fastest Road to Lifting Your Real Speed Measurements

The performance series opens with the metric grabbing attention first and drawing everyone's complaints: LCP, measuring when your visitor actually sees the page's main content. This metric is your site's numeric first impression, answering the question every visitor asks in the first seconds: is this site ready? In this guide we walk step by step from diagnosing your page's specific responsible element, to fixes ordered by real impact, to the measurement proving your work landed. The guide serves static-site owners and platform users alike, and every step in it costs nothing to execute.
What you will do in this guide:
- Diagnose your pages' LCP element and know exactly why it lags
- Apply fixes ordered by impact — images, then fonts, then loading order
- Measure your result on real visitors' data, not a clean test
- Build a routine protecting this metric with every new publish
What LCP Actually Measures: A Definition Everyone Understands
LCP measures the time from page load start until the largest visible element in the visitor's first screen appears — usually the article's cover image, its main heading, or a large text block. The system computes the metric from real visitors' experiences and takes the number achieved by seventy-five percent of your visits: the official target is under two and a half seconds, two-and-a-half to four needs improvement, and above four is poor, losing visitors before they read a single letter.
Whoever understands this definition well realizes LCP is not your site's average speed but the speed of your slowest quarter of visitors — improving it means helping your worst cases: the visitor on a mid-range phone, weak network, congested hour. This angle defines every later decision: real optimization targets the actual device and network, not your fast laboratory. I explained the full basis of the three metrics in the comprehensive Core Web Vitals guide, worth reading before or right after this guide, and for anyone preparing a site for approval these fixes are part of the pre-submission checklist.
Step One: Diagnose Your Page's LCP Element
Do not start fixing before diagnosing — every page has a different LCP element with different lag causes: open PageSpeed Insights, enter a representative article URL, and find in the diagnostics the "largest contentful paint element" line naming the responsible element and its lag contribution share. Then open Chrome's developer tools, go to the performance panel, and run a measurement in a throttled environment — you will see the element's loading bar with its stage details: when requested, when arrived, when shown.
This diagnosis settles your path into three scenarios: a cover image means the images-fix path; a text element means the fonts-and-render path; both lagging behind competing requests means the loading-order path. One documented diagnostic hour across three representative pages saves you days of random experimentation — and log your numbers before fixing in a measurement sheet, so you compare afterward honestly, not by impression.
Image Fixes: The Largest Gain on Most Sites
The cover image is the LCP element on most article pages and often the largest file on the whole page — start with three ordered fixes: a modern compressed format like WebP cutting size roughly in half while keeping quality; display dimensions matching the element's actual maximum width in your template, not multiples of it; and high loading priority telling the browser this is the first request, not the last. On our static sites these are attributes on the image tag, and their effect shows in the test immediately.
Add two decisions many get wrong: never lazy-load the cover — lazy-loading the first element delays its own appearance; and never place your image inside an element appearing late through animation or JavaScript conditions. Images inside the article body suit lazy loading perfectly, sitting below the fold — distinguishing the image seen now from the image seen later is the essence of image performance, a one-minute decision per image repaying itself on every visit.
Font Fixes: Preventing the White Gap
The beautiful custom font costs you a waiting moment: text does not show until the font file arrives, so your page opens on emptiness then jumps to text — and that delay rises straight into LCP. The treatment has three layers: cut font weights to what you actually use; enable the swap display showing text in the system font immediately then replacing it on arrival; and preload the font file if the font itself is your pages' LCP element.
In Arabic templates pick one font family with two weights — regular and bold — as we use here: it cuts requests and size together and gives a consistent identity. And confirm your fonts are served with long cache headers so the returning visitor does not reload them — this lifts internal-navigation speed, which the system reads across the whole user experience metrics.
Loading Order: What Competes With Your LCP Element
After images and fonts comes the deeper question: what happens before your LCP element's request? Every early request crowding it — template scripts, external styles, tracking tools — delays its start. Open the network panel in developer tools, sort requests by time, and you will see the congestion line preceding your image — start reducing: defer every script not essential to first render, cut external requests to those whose results you actually read, and merge small scattered styles if you manage them manually.
On static sites this stage is usually short because our scripts are few, but add the third-party scripts added over time: analytics, later ads, share buttons. Each one's price is fractions of a second cut from LCP, and the sum when accumulated hijacks your numbers. My standing practical rule: every new addition passes one question — what does it add to the visitor and what does it cut from speed? Whoever cannot answer the first does not deserve the second.
| Fix | Effect on LCP | Effort |
|---|---|---|
| Compress cover, convert to WebP | Very large on image pages | Minutes per image |
| Loading priority for the first element | Large | One code line |
| Preloading the used font | Large on text pages | One header line |
| Deferring non-critical scripts | Medium to large | Script list review |
| Resizing images to actual display | Medium | Set at upload |
Server and Distribution: The Floor Beneath Everything
Before everything above stands a floor the page never shows: the server's first response time — the page starts loading only after the server answers. Our static sites on a global distribution network answer from the visitor's nearest point, closing this floor automatically at best shape; struggling shared hosting starts everything late however good your images and fonts. If your server response sits above a few tenths of a second in measurements, fix it first — everything else builds on it.
For traditional hosting, the available gradual solution: a free distribution network in front of your site caching your static files and serving them from near points, or moving to static hosting if your site needs no live server at all — most text blogs' case. This architectural decision outweighs all image fixes combined on geographically spread audiences: proximity servers are the difference between a Gulf visitor and a Moroccan visitor feeling the same speed. I explained the static philosophy in the Road to AdSense foundations part.
A Real Mobile Case: LCP on Phone Pages
The mobile page is not a shrunken desktop copy but a wholly different environment: variable network, slower-processing device, and a screen reordering elements — the LCP element itself may change. So never trust a desktop test result for your pages: always run the mobile profile in PageSpeed, and check your site from your phone on real data once every two weeks — this live check reveals sensory slowness no simulation shows.
The same fixes apply to mobile with reordered priority: image compression leads because the network is slower; script reduction follows because processing is weaker; fonts third because text display is usually the mobile screen's LCP element. Whoever fixes for mobile first finds desktop fast automatically — the reverse is not true; make the mobile environment your actual development environment for the rest of this performance series.
Simple Automation: Protecting LCP Without Daily Burden
Once your site is fixed, preventing relapse matters more than further improvement — protection here is simple procedures merged into your routine: a compression tool processing every image at upload before publishing so no raw image ever reaches the site; a publish checklist including a quick PageSpeed check before announcing the article; and a monthly review reading the user experience report, alerting on any early negative trend.
With these three, performance turns from a recurring project into a permanent site property: every new article is born on the old ones' standards, and the decline waiting for many sites months after launch finds no gap to enter yours. This is the real meaning of performance management — a small maintenance system working behind the scenes protecting a digital asset built from months of work.
Measuring After Fixing: Proving You Won
After every fix batch, measure in two places: lab testing via PageSpeed seeing each change's direct effect, and field data in Search Console's user experience report seeing its effect on real visitors across weeks. The test answers: did I improve technically? The field answers: did visitors feel it? Both answers are required — a lab improvement with no real reflection means you fixed a state your visitors never live; field lag is normal since it accumulates over two to four weeks.
Document in your measurement sheet: the change date, what you changed, and the LCP number before and after in testing — this log turns your site from things-done into understood-impact decisions, teaching you which fixes deserve repeating in your coming sites. After two or three rounds your site's pattern appears: its standing pain point, the tools that actually move it — and then performance management becomes an organized habit, not a recurring emergency campaign.
Real Scenarios: Three Sites, Three Paths
To fix the method, imagine three recurring cases. Site one: a static blog with partially compressed images — its LCP element is an oversized cover; its path is short: convert covers to WebP at correct dimensions with loading priority, and a big jump lands in one day. Site two: a platform site loaded with tracking plugins — its element is an image too, but preceded by a script queue; its path starts with inventorying plugins and deferring the non-essential before touching any image, because the image is not guilty in this case.
Site three: a text site with no large images — its LCP element is the main heading text waiting for a custom font; its path lives entirely in the fonts layer: preload, swap display, weight reduction, then reviewing the request queue. All three started from the same metric and ended in completely different paths — this is the real lesson of diagnosis: no unified recipe, but reading your own position then pulling the right thread from its start. Every guide in this series hands you the threads and their order.
What Comes After LCP: The Series' Remaining Map
Fixing LCP opens the rest of the metrics' doors — the series builds on it: part two covers INP, the interaction-response metric suffering from the same scripts you deferred here; part three covers CLS and element stability served by the same reserved dimensions. Whoever completes this guide owns half the performance road; the rest is the same methodology applied to other metrics.
And a direct earnings connection worth repeating: every second cut from first appearance cuts part of your coming ads' exposure opportunities, and the visitor seeing content quickly walks deeper into your site where your ad units live. Performance is not a technical chapter separate from your site's viability — it is the structure everything else stands on; that is why the series opened with it.
The Short Tool List For Your Journey
You need no massive toolkit for this path — three places suffice a whole site: PageSpeed Insights for quick measurement and diagnosis; Chrome developer tools for network-bar depth and recording; and the user experience report in Search Console for weekly field tracking. Add the free WebPageTest service when you need measuring from different geographies and networks — these four cover everything a mid-size site needs of diagnosis and follow-up without one subscription.
The rule in using them is discipline, not volume: measure before and after every batch, log numbers in one sheet, read the field monthly. Whoever scatters themselves across ten tools loses the thread; whoever holds the assigned three builds a routine showing stable numbers across months — and that is the goal: managed performance, not chased numbers.
Choosing Your Three Representative Pages
Choosing representative pages decides the honesty of all later measurements — open your performance report and pick: the most visited page, your longest image-heavy article, and your newest published one. These three represent your site's three living patterns: the interface, the heavy page, and the new page repeating thousands of times ahead. Log them in your measurement sheet by name and link and never change them, so your comparisons stay on the same base.
As the site grows, add a fourth page each quarter representing any new pattern appearing: an active category page, a service page, a new long guide. This quiet evolution keeps your measurements addressing your site's reality, not its memories — among the finest performance-management details everyone neglects then wonders why their numbers say nothing real.
Common Mistakes in the LCP Race
The most common: early surrender after fixing images, when the metric does not reach target and frustration takes over — the truth is correct ordering usually needs three batches: images, then fonts and ordering, then server. A second mistake: fixing only the homepage and forgetting article pages where visitors actually arrive from search — the most important measurement sits on content pages, not the display interface. A third: over-optimizing beyond need, removing every image or shrinking texts — the number improves while the experience breaks, for the metric serves the experience, never rules it.
The most dangerous of all: full surrender under the claim that Google does not actually count speed in ranking — confusing speed being a supporting factor with it having no effect: the visitor leaving before appearance read nothing, watched no ad, shared nothing, and losing them is real in every site metric regardless of your search positions. Speed is an investment in every visitor's stay — that alone suffices as reason to work on the metric without waiting for Google's verdict.
Questions From Those Starting Optimization
My LCP element is text and image together — which do I fix?
Check the diagnosis: it names the winning element at measurement time, often the text appearing before the image — start with fonts, preload, and loading order. But if the image exceeds the text in size many times, priority goes to it as the bigger obstacle. The practical rule: fix the heaviest first then re-measure — the metric improves by ordering, not by stacking every fix at once.
Is hitting the target in lab testing enough?
Testing is necessary but insufficient — the official metric reads from real visitors with their diverse devices and networks: you may hit target in your lab while failing in the field due to weak-network or mid-range visitors. Make the test the quick verification gate after every change, and the field the final judgment reference across weeks — this balance saves you from resting on lab numbers not living your visitors' reality.
How many pages do I measure before judging my site?
Measure three representative pages minimum: homepage, one long image-heavy article, one recent short article — covering your core page patterns. A site is judged by the pages receiving its search visitors, not its best pages — the article page is your site's performance identity card, and measuring it weekly suffices for monitoring the whole performance health without drowning in per-page measurement.
Will ads later affect the LCP I improved?
Yes, if misplaced — keep their positions away from the first element and never crowding its loading, with pre-reserved dimensions protecting page stability as well. Wisely placed ads do not cancel your improvements but coexist with them: the site fast before ads is the most capable of bearing their weight without crossing metric limits. Fix your base first, then activate ads in calculated positions as the safe activation plans explain.
Guide Summary
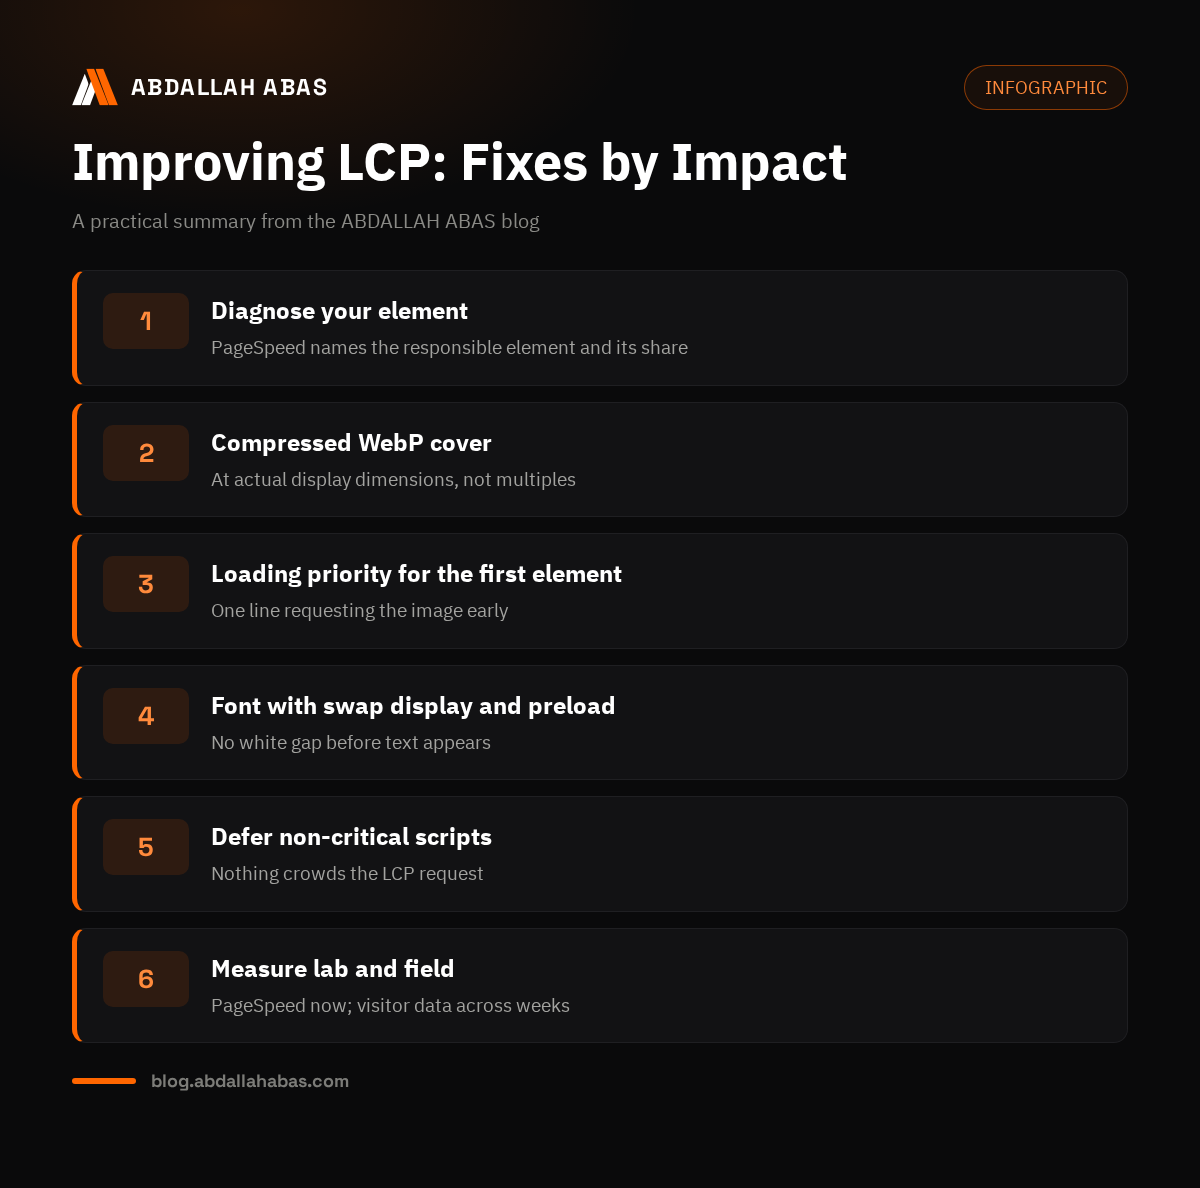
Improving LCP is a four-stage path: diagnose your element and causes with free tools; fix images before fonts before loading order; review the server floor if late; then measure without pause on lab and field together until your number settles safely. In every stage this guide's list guides you by impact, not noise — correct ordering is half the success in performance, and the other half is honest measurement proving your effort reached your visitors, not just lab numbers.
Keep this guide's checklist beside your publishing routine, and every new article will inherit the standard instead of testing it. The three biggest fixes remain: a compressed cover with loading priority, a font with swap display and preload, and deferred scripts never crowding the first element — the trio carrying most of the improvement on nearly every site.
Whoever applies this guide to their three representative pages lands a clear measurable jump within a week, then turns application into a habit with every new publish. The series' next part moves to the INP interaction metric and its improvement road — follow the parts in sequence and you will find your site at their end on standards matching big invested platforms: a real difference the visitor sees before any measurement system does.
Comments