
Core Web Vitals Explained: The Three Metrics That Tell You How Fast Your Site Really Is

When people talk about your site's speed they are not talking about one number in an interactive test, but about three specific metrics measuring your visitors' real experience: how fast the main content appears, how fast the page responds to interaction, and how stable elements are while loading. Google named these Core Web Vitals and made them part of page experience evaluation, but what matters to you is not the name — it is what they mean for a real visitor opening your site from a phone on an ordinary data connection. In this article I explain the three metrics in practical language, with free measurement and fixes I have applied on real sites.
What you will actually do after reading this article:
- Understand what each metric — LCP, INP and CLS — measures in human language
- Measure your site's metrics for free from one trusted tool
- Apply fixes ordered by their real impact without paid tools
- Build a simple monitoring habit that protects your speed with every change
What Core Web Vitals Are and Why They Actually Matter
The core page experience metrics are three numbers measuring different aspects of a visitor's first minute on your site. The first asks your site to show its main content quickly, the second asks it to respond instantly when the visitor taps something, and the third asks it not to move elements under the visitor's finger while loading. Google collects these numbers from real visitors' browsers through the user experience report, so they reflect reality, not a clean laboratory.
You may ask: do they affect my rankings? The honest answer is that speed is a confirming factor, not a launching one — poor metrics will not push an excellent-content site to page ten, but they will cost you visitors who leave before reading anything, and that alone kills any ranking you build. For anyone working on ad revenue the effect is clearer: a visitor waiting three extra seconds may leave before seeing the first ad, so speed is direct income, not a technical luxury.
The First Metric — LCP: How Fast Your Main Content Appears
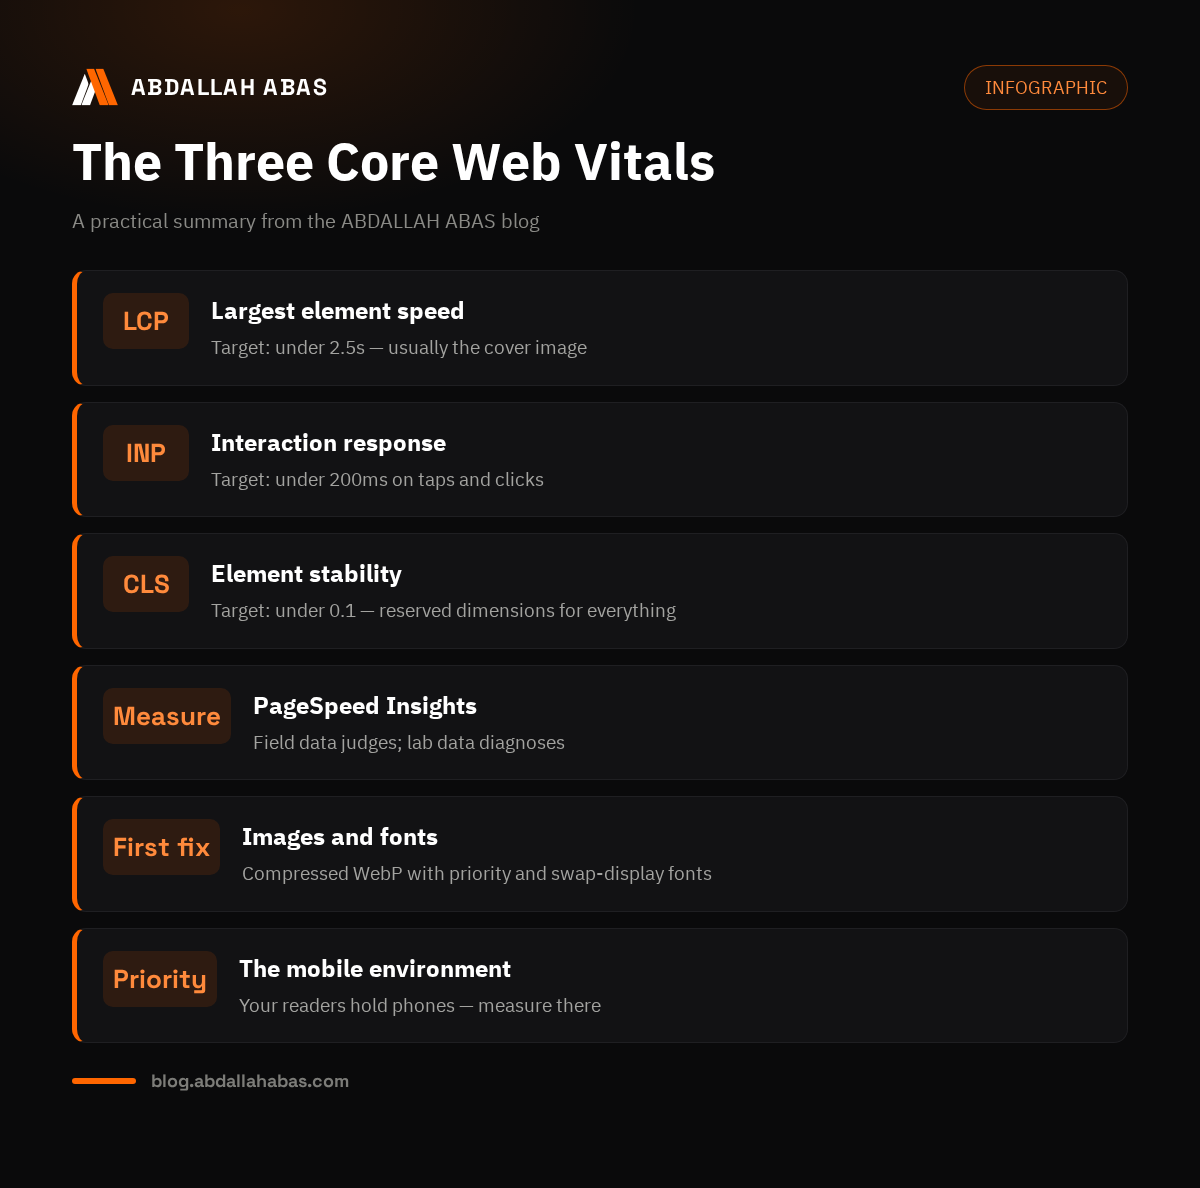
LCP measures the time until the largest visible element in the visitor's initial screen appears — usually the cover image, the main heading, or a large text block. The target is under two and a half seconds for seventy-five percent of your visits, because the metric is computed from the visit distribution, not the average. A visitor who sees the main content quickly feels the site is ready immediately, even if secondary parts are still loading behind it.
The most common LCP weaknesses I keep seeing: uncompressed hero images, web fonts that block text display until fully loaded, and scripts loading ahead of content. The fix starts with the cover image itself — use a modern compressed format at real display dimensions, not double the size, and add high loading priority to the hero image and first heading. On static sites like this blog these things come configured in the template; on other platforms, verify them first before any deeper optimization.
The Second Metric — INP: How the Page Responds to Interaction
INP measures the page's response time to visitor interactions — taps, clicks, and keyboard presses — taking from these interactions the worst near-always experience most visitors meet. The acceptable target is under two hundred milliseconds, a very short window meaning the page answered the visitor's tap directly, even if the visual response is as simple as opening a menu or coloring a pressed button. Fast response creates a feeling that the site is alive, and the feeling matters more than the number itself.
The primary cause of poor INP is too much work running in scripts at the moment of interaction — especially on sites loaded with tracking tools, embedded blocks, and report widgets all firing at the same moment. The practical treatment: cut external scripts to the actual necessity, defer what is not needed on first load, and never pull in a whole library to operate one small button. Every script you stop from blocking gives you better response without touching a single line of site logic.
The Third Metric — CLS: Element Stability While Loading
CLS measures unexpected movement of page elements during loading — the metric that justifies itself on first experience: a visitor reads a paragraph, the text jumps up because an image loaded late, and they accidentally tap an ad button or a link they never wanted. The acceptable target is under one-tenth of a point, a threshold that requires discipline in declaring every element's dimensions upfront instead of letting the browser discover them late.
The basic fix is simple and logical: declare explicit width and height for every image, ad slot, and embed, so the browser reserves their space immediately and nothing around them jumps. Ads in particular must have pre-reserved space — a condition of good manners before activating any network, and why we insist in this blog that no ad reserves a slot while disabled. A paragraph that stays where it started preserves your readers' session and your site's reputation in the same moment.
How to Measure Your Metrics for Free, the Right Way
Start with Google's free PageSpeed Insights, enter your page URL, and read two differently-weighted parts: the field data section from real visitors when available, and the lab diagnostics from a test environment. Field data is the truth that governs; lab data is useful for diagnosing the problem's causes in detail. Repeat the measurement on your homepage and one representative article page — a site is not judged by its best page but by the pages carrying most of its visits.
For deeper precision you sometimes need tools that explain what happens inside the page: the Lighthouse panel built into Chrome gives a report of each metric's causes with improvement opportunities ranked, and the free WebPageTest service checks your site from different countries on different device types. Do not make these your daily routine — call them when the number alone cannot identify the cause, because deep diagnosis saves you from edits you cannot explain the failure of.
After the first check, collect the three numbers on one card per page and record the date — this simple card becomes your reference for measuring the effect of every later change. Remember the metrics move with your visitors' device and network mix, so never judge from one measurement but from the trend across weeks. This simple habit turns speed from an occasional worry into a clear management routine.
| Metric | What it measures | Target | Most common cause of failure |
|---|---|---|---|
| LCP | Time until largest element appears | Under 2.5s | Heavy uncompressed hero image without priority |
| INP | Page response to interaction | Under 200ms | Too many scripts running at tap time |
| CLS | Element stability while loading | Under 0.1 | Images and ads without declared dimensions |
Measuring Across the Whole Site, Not One Page
A common mistake is measuring only the homepage and judging the whole site from it, while your visitors actually land on article pages directly from search results. Pick three pages representing your real traffic: the homepage, one long image-heavy article, and one recent short article, and measure all three every time. The number Google and your visitors care about is the average of their experience on the pages they actually reach, not the page you personally polished.
Record results in a simple table with three columns: the page, the three numbers, and the measurement date. This table reveals patterns: if only the long article page is slow, its images are the problem; if all pages lag equally, the problem is in the template, shared scripts, or hosting. This pattern reading saves you days of random searching and turns every later edit into a directed experiment with a known outcome.
Web Images in Depth: The Largest File on Your Page
The image is usually the largest file on an article page, and deserves detailed treatment, not just general compression. Pick the right format: WebP for nearly everything, with JPEG as a compatibility fallback for old browsers if needed. Set display dimensions to the actual maximum your template shows — a 2000-pixel-wide image inside a 700-pixel column is a file three times larger with zero visual benefit. A free compression tool is enough; you need no paid software for this work at all.
For the cover image specifically — the LCP element on article pages — add high loading priority so the browser requests it early before secondary resources, and confirm it is not below the fold or wrongly lazy-loaded. Images inside the article body below the screen suit lazy loading perfectly, since the visitor does not see them on open. This balance between loading now and deferring later is the essence of image performance — four lines of attributes changing the whole page experience.
Deferring JavaScript in Non-Programmer Language
You do not need to be a programmer to understand the JavaScript problem: every script in your page asks the browser to stop rendering and do other work first. Two basic attributes organize this work: defer tells the browser the script can wait until the structure finishes rendering, and async tells it the script can load in parallel with everything else. Tracking tools like Google Analytics use async naturally — what you need to do is apply defer to non-critical template scripts.
On static sites like ours the script list is short and hand-written, so cleanup is easy and direct. On platforms injecting scripts from multiple plugins the task is harder but more important, because every plugin adds requests and execution you know nothing about. Open your browser's developer tools, go to the network panel, sort requests by size or time, and you will often be surprised by twenty requests from tools you do not remember enabling. Delete decisively — every deletion shows its effect in the metrics immediately.
Mobile Speed: The Real Verdict
Most visitors to Arabic content sites arrive from phones, so your site is practically measured on a small screen with a variable connection, not on a desktop with fast fiber. Google itself uses mobile-first indexing — the mobile version is what gets crawled and officially evaluated. So always test your site from your actual phone on mobile data, and open it while the network is congested, like during a commute: that scene is your visitor's real day, not the exception.
Device differences themselves deserve respect: a mid-range phone processes scripts much slower than a flagship, which is why a page feels fast on your device and heavy on your visitor's. Field data in PageSpeed accounts for this diversity automatically, making it the most honest mirror. I explained this logic in detail in the mobile-first article of the Road to AdSense series — read it to complete the picture from the design angle too.
How Speed Serves SEO and Earnings Together
Google explicitly states Core Web Vitals are part of the page experience signals feeding ranking, and the honest framing of reality is that the effect appears at the margins: a very slow site loses its position to a similarly-contented faster competitor, and a fast site does not miraculously leap over weaker content. What matters is that speed works in your favor compounded with the other factors, not as a standalone trick — which is exactly what your serious competitors do.
Speed's effect on earnings is more direct than its effect on ranking: a longer session means more page views, more page views mean more ad opportunities, and a comfortable visitor who reaches content quickly keeps reading where your ads live. Add that site speed is a practical condition in preparing a site for AdSense as I covered in the full checklist — the three metrics serve two goals in one step.
One Week of Realistic Improvement
Structure the week as follows: day one, measure and document the two most important pages; day two, compress images and set dimensions; day three, clean up fonts; day four, review scripts and remove the non-essential; day five, reserve dimensions for embeds and ad slots; day six, re-measure and compare; day seven, document changes and lock them in. This plan is enough for a small site to cross the acceptable threshold of all three metrics in most cases.
After the week, keep a light routine: a quick monthly measurement after every major change, and watching the user experience report in Search Console showing your real visitors' trends across months. And if you are building a new site now, start with a fast frame from day one — fixing a clean site is always easier than rescuing one buried under additions, as I explained in the foundations article.
Questions Site Owners Ask About Speed
Do the metrics affect ranking directly?
They enter page experience signals and matter at close margins: when two competitors match in content strength, speed tips toward the faster one. But speed alone produces no miracles — weak content on a very fast site stays weak in results. Treat the metrics as a floor where no points get wasted, then make your real strength the content and the search intent you address.
What is the difference between lab tests and real visitor data?
Lab tests run in a clean environment on uniform devices, while field data comes from your actual visitors' browsers with their diverse devices and networks. Google judges by field data because it represents reality — which is why you may see your site excellent in tests but weak in the report, or the reverse. Use lab data for diagnosis and field data for judgment, focusing improvements on what your real visitors see.
Do heavy services like chat widgets ruin my metrics?
Every external tool carrying scripts and execution affects the metrics to varying degrees, and chat widgets are among the heaviest additions to small sites. If you truly need one, defer its loading until content completes, and measure the difference before and after. On search-focused content sites, a clear contact form usually achieves communication goals with far less performance cost than a live chat window.
Do I need a CDN for my small site?
A content delivery network serves your files from servers geographically closer to visitors, cutting access time and load on your origin server. For a small site with an audience centered in one country the benefit may be small, but if your audience spreads across the Gulf, Egypt and North Africa the effect on each one's LCP is clear. GitHub Pages hosting used by static blogs comes with a global distribution layer built in — you get the advantage at no extra cost.
Are ready-made templates slow by nature?
The template itself is rarely the full cause — a clean template, however ready-made, stays faster than a pile of add-ons stacked on it. The problem is usually what gets attached: many fonts, unrequested sliders, icons loaded as a full library to use five. A good template gives you a healthy floor; discipline in what you add after preserves performance — the same logic this blog's template was built on.
Will ads affect these metrics later?
Yes — ads add requests, execution, and variable dimensions, which is why a site fast before ads stays acceptable after them while a slow one gets worse. Follow two rules at activation: reserve each ad unit's dimensions beforehand to protect CLS, and never exceed two or three positions inside the article however tempting. Remember the ads-to-content ratio is a policy condition too, not just a speed matter — excess hurts both sides at once.
Which metric do I fix first?
Start with the metric scoring worst in your real visitors' data — the compounded effect is largest when you lift the weakest point. If the numbers are close, start with LCP since its fixes are usually the simplest with the fastest effect: images, fonts, and loading priorities. Then move to CLS by setting dimensions, and leave INP for last since it usually needs deeper, gradual script review.
Conclusion: Three Numbers That Protect Your Visitors' Experience
The three metrics are not a technical obsession but a numeric translation of a real visitor's feeling: I saw the content fast, the site answered when I touched the screen, and the text did not jump under my finger. Measure your numbers today, apply the week plan, and keep a light monitoring routine. Start with your weakest metric — every point of visitor experience improvement returns to you as longer sessions, better rankings, and cleaner earnings. And if you want a new site that comes fast from day one with pre-configured standards, that is the core of my web development service, because speed is built in the template before the content.
Comments